Application Operations Management (AOM)
Take advantage of our consulting services!
Our experts will be happy to help you.
Hotline: 24 hours a day, seven days a week
Application Operations Management (AOM)
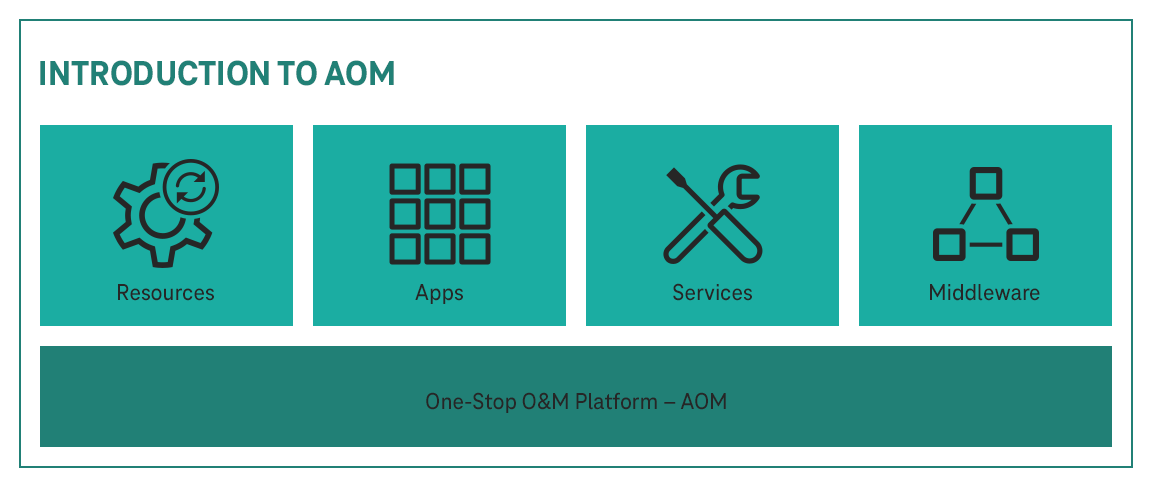
Application Operations Management (AOM) can be considered as single point of access by operations and management for logs, alarms, and diagnostics for applications (including distributed applications) and resources (such as computing, storage, and network resources). It detects and monitors applications and connects to cloud services such as Cloud Container Engine (CCE) to obtain O&M data for in-depth monitoring and issues pre-detection through different anomaly detection policies (such as static threshold and dynamic threshold) and pre-notification through events and alarms.
Application Operations Management comprehensively monitors and uniformly manages cloud servers, storage devices, networks, web containers, and applications hosted in Docker and Kubernetes, effectively preventing problems, facilitating fault locating, and reducing O&M costs.
AOM also provides unified APIs for interconnecting self-developed monitoring or reporting systems.
Viewing Alarms
Alarms are reported when Application Operations Management (AOM) or an external service, such as Cloud Container Engine (CCE) is abnormal or may cause exceptions. Alarms need to be handled. Otherwise, service exceptions may occur.
Viewing Events
Events generally carry some important information. They are reported when Application Operations Management (AOM) or an external service, such as Cloud Container Engine (CCE) encounters some changes. Such changes do not necessarily cause service exceptions. Events do not need to be handled.
Static Threshold Rules
Application Operations Management (AOM) is interconnected with Simple Message Notification. After you set a notification policy on the SMN console, notifications are sent by email or Short Message Service (SMS) message if the status of the static threshold rule changes (Exceeded, OK, or Insufficient). In this way, you can notice and handle exceptions at the earliest time.
The service list displays the type, CPU usage, memory usage, and alarm status of each service, helping you learn the running status of each service. You can click a service name to learn more about the service status. Application Operations Management (AOM) supports drill-down from a service to a service instance, and then to a container. In this way, you can implement multi-dimensional monitoring.
AOM monitors host resource usage in real time and alerts you to potential heavy usage, allowing you to adjust resource allocation before hosts run out of resources.
Container monitoring, host monitoring adopts the hierarchical drill-down design. The hierarchy is as follows: host list > host details. The details page contains all the instances discovered on the current host as well as resource usage of the instances.
Dashboard
Different metrics can be displayed in line graphs, pie charts, progress bars, or lists on the same screen. In typical scenarios, key metrics of important applications can be displayed in a dashboard to facilitate application status monitoring in real time. Different metrics can also be displayed on the same GUI for comparison. In addition, you can add metrics for routine O&M to the customized dashboard so that you can perform routine check without re-selecting metrics.
The dashboard can display two types of data: metric data and status data. Metric data can be displayed in line graphs or digit graphs. Status data includes threshold-crossing statuses, host statuses, and service statuses.
Metric Monitoring
Metric monitoring displays metric data of each resource. You can monitor metric values and trends in real time, add concerned metrics to the dashboard, create threshold rules, start second-level monitoring, and export monitoring report. In this way, you can view services in real time and perform data correlation analysis. You can also quickly add a metric graph to a dashboard and export metric data to a local PC in CSV or TXT format.
Viewing Log Files
You can quickly view log files of service instances to locate faults.
Searching for Logs
Application Operations Management (AOM) enables you to quickly query logs, and use log source and context to locate faults.
Log dump
AOM dumps logs to the Object Storage Service (OBS) bucket for long-term storage. After the log dump configuration is complete, the trust relationship is established between the log bucket and OBS bucket. AOM dumps the logs generated on the previous day to the OBS bucket at 01:30 every day based on the configured dump cycle.
Log analysis
Logs contain information such as system performance and services. For example, the number of keywords ERROR indicates the system health. To know such information, you can create a statistical rule. After the statistical rule is created, AOM periodically collects data by keywords. Then AOM generates metrics data for you to better understand the system performance and service information in real time.
The ICAgent is installed by default when the CCE cluster is installed. The ICAgent runs as a process on the user's host. Each host will deploy one ICAgent. Users can view the ICAgent running status, upgrade the ICAgent version, uninstall the ICAgent, and install the ICAgent from the AOM interface. The ICAgent is currently supported only on Linux OS.
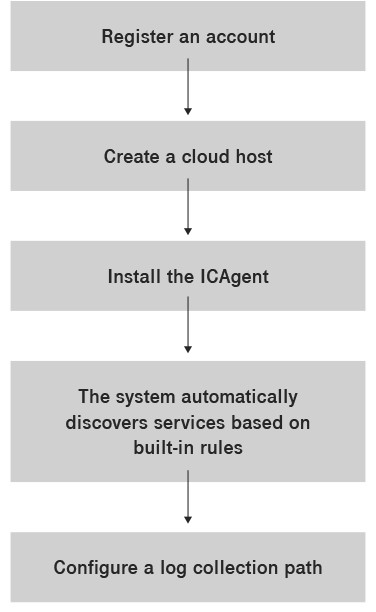
Register an account. (Mandatory)
Obtain a cloud platform account first.
Create a cloud host. (Mandatory)
A host correspondents to a VM (for example, ECS) or physical machine (for example BMS) on the cloud platform. You can create hosts on the ECS or BMS console, or on the CCE console.
Install the ICAgent. (Mandatory)
The ICAgent collects metrics, logs, an application performance data. For hosts created on the CCE console, the ICAgent is automatically installed. ICAgent is the collector of AOM. It runs on each host to collect metrics, logs, and application performance data in real time. Ensure that you have installed the ICAgent before using AOM.
The system automatically discovers services based on built-in rules.
Connect host services to AOM for monitoring. After the ICAgent is installed, the services that meet the built-in service discovery rules on the host will be automatically discovered.
Configure a log collection path. (Optional)
The ICAgent collects logs from the configured path and displays them on AOM. To view the logs of the monitored host, you must first configure a log collection path. Then the ICAgent will collect host logs from the configured path and display them on AOM.
You can use AOM functions such as dashboard, monitoring, alarm, and log management to implement routine O&M.
O&M overview
Overview
View management
Dashboard
Monitoring metrics
Monitoring
Monitoring hosts
Monitoring workloads
Monitoring services
Alarm Management
Creating threshold rules
Viewing alarms
Viewing events
Log Management
Viewing log files
Searching for logs
Viewing bucket logs
Send us your feedback!
What can we do better? What works well?
Further information can be found in the AOM area of the Help Center.
* Voucher can be redeemed until December 31, 2023. Please contact us when using the voucher for booking. The discount is only valid for customers with a billing address in Germany and expires two months after conclusion of the contract. The credit is deducted according to the valid list prices as per the service description. Payment of the credit in cash is excluded.