Open Telekom Cloud for Business Customers

Application Performance Management (APM)

Using this service, you can rapidly identify and optimize the most resource-intensive parts of your Java cloud applications. Analyze code performance in production, at any scale, with minimal overhead. The Application Performance Management (APM) service allows to pinpoint problems, such as slow methods at thread-level, to quickly understand what is causing a spike in latency, CPU utilization, or memory allocations.

With the help of the APM service, you can isolate the most inefficient functions to troubleshoot faulty deployments, and enable informed decisions on rollbacks or bugfix deployments. You can also compare code behavior and impact across nodes, versions, and time ranges during canary, blue/green, or shadow deployments.

Analyzing code performance with Application Performance Management

Reasons for APM in the Open Telekom Cloud

Icon composition: sliders and hand

Identify bottlenecks

In modern micro-service architectures, complex call relationships between internal, external and 3rd party API’s bring new challenges. APM helps to analyze end-to-end transactions to identify performance bottlenecks.

Icon composition: Server and diagram

Increased observability

APM combines logging, metrics and traces for events and transactions, enabling end-to-end observability for distributed solutions and cloud services. Compare behavior and impact across hosts, versions, and time ranges during canary, blue/green, or shadow deploys.

Icon composition: coding and speedometer

Topology discovery

Many highly diversified middleware technology ranges are in use and are rapidly changing. An automated and fast discovery of dependencies & changes helps to analyze the latest state of the architecture.

Icon composition: Alarm bell and tools

Intelligent alarming

Complex alert rule-sets can be defined for specific topology parts or covering full end-to-end transactions. Templates can be created and quickly assigned to processing nodes. Alerts and automated recovery procedures can be triggered using SMN or functions.


Key Features of APM

Metric monitoring & request timing

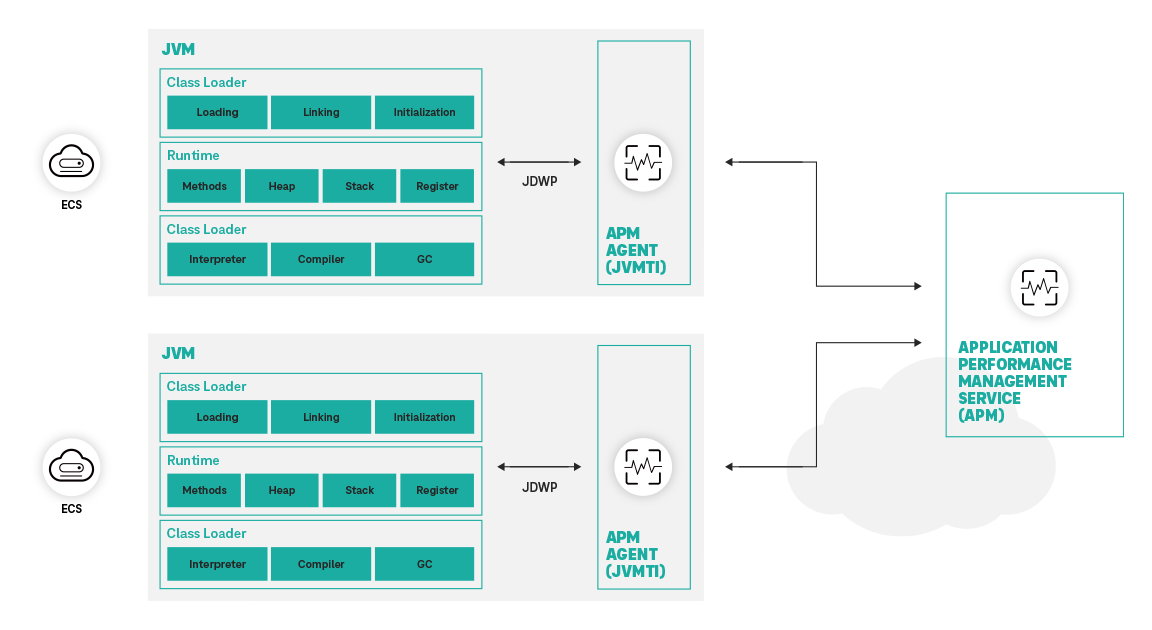
APM Agents collect metrics of JVM, GC, service calls, exceptions, external calls, database accesses, and Java middleware applications, helping you to analyze the behavior of your cloud applications.

  • Identify start and end points of entire transactions
  • Analyze time spent for each step during processing
  • Collate request response times with resource consumption
 
Icon with mouse pointer on document


Application topology discovery

Use the topology to view the call relationships between services, check whether the calls between services are performing as expected, and quickly locate faults. You can also view the trend and compare specific periods.

Icon with code symbol and checkmark symbol


URL tracing

Trace the downstream calls for selected APIs. Through URL tracing, you can monitor the call relationships between important APIs and all involved services to detect bottle-necks and exceptions more precisely.

Icon with alarm bell and light bulb


Intelligent alarm reporting

Complex alert rule-sets can be defined for specific topology parts or full end-to-end transactions. Templates can be created and assigned quickly to processing nodes. Alerts and automated recovery procedures can be triggered using SMN or Functions.

 
Icon with mouse pointer on application


Collection center

You can view and manage various collectors, metrics, and collection parameters supported by APM in a granular way. You can control what traces and metrics are collected.

Icon with magnifying glass and data block


Data masking

The data collected via APM Agents will be masked based on the policies you set.


Structure and Function

Structure and function of Application Performance Management (APM)
 

Neue Features

APM launchend in EU-DEView Details
 

Find out more

 
  • Communities

    The Open Telekom Cloud Community

    This is where users, developers and product owners meet to help each other, share knowledge and discuss.

    Discover now

  • Telefon

    Free expert hotline

    Our certified cloud experts provide you with personal service free of charge.

     0800 3304477 (from Germany)

     
    +800 33044770 (from abroad)

     
    24 hours a day, seven days a week

  • E-Mail

    Our customer service is available free of charge via E-Mail

    Write an E-Mail

  • AI Chat

    AIssistant

    Our AI-powered search helps with your cloud needs.